Distribution Expansion and Robust Demand Drives Strong Double-Digit Growth;
Domestic Revenue Increases 47% to $16.8 Million
Boca Raton, FL (November 7, 2019) – Celsius Holdings Inc. (Nasdaq: CELH), maker of the leading global fitness drink, CELSIUS®, today reported financial results for the three and nine months ended September 30, 2019.
2019 Third Quarter Financial and Business Highlights:
- Revenue of $20.4 million, up 23% from $16.6 million in the year ago quarter
- Domestic revenue increased 47% to $16.8 million, up from $11.4 million in the year ago quarter
- Driven by continued strong double-digit growth in all channels of trade and distribution expansion.
- Domestic normalized revenues grew 66% when adjusting for a delay in shipments in Q2 2018 to Q3 2018 of $1.3 million in the prior year.
- International revenue decreased 30% to $3.7 million, down from $5.2 million in the year ago quarter
- Mainly due to a change in our China business model to a royalty and licensing framework effective January 1, 2019 which mitigates risk and reduces marketing investments, but which correspondingly decreased revenue by $1.2 million
- Nordic distribution partner revenues decreased $435,000 in the quarter due to timing orders and promotional programs.
- Gross profit of $8.6 million, up 26% from $6.9 million in the year ago quarter
- Net income to common shareholders of $961,042 million compared to a net loss to common shareholders of $(4.2) million in the year ago quarter
- Non-GAAP Adjusted EBITDA*, excluding one-time charges, totaled $2.6 million compared to $2.2 million in the year ago quarter.
- Closed public offering of 7,986,110 shares of common stock at an offering price of $3.60 per share for total gross proceeds of $28.7 million
- Secured additional distribution agreements with partners in the Anheuser-Busch InBev, PepsiCo, Keurig Dr. Pepper and MillerCoors networks, further expanding distribution to new regions as Celsius builds out its national distribution network which now includes over 70 regional direct store delivery (DSD) partners
- Expanded product portfolio with the launch of a branched-chain amino acids (BCAA) functional beverage that fuels muscle recovery
- Domestic revenue increased 47% to $16.8 million, up from $11.4 million in the year ago quarter
* The Company reports financial results in accordance with accounting principles generally accepted in the United States (“GAAP”), but believe that disclosure of adjusted EBITDA, a non-GAAP financial measure, may provide users with additional insights into operating performance.
2019 Year-to-Date Financial Highlights:
- Revenue of $51.0 million, up 35% from $37.9 million in the year ago period
- Domestic revenue increased 52% to $42.6 million, up from $28.0 million in the year ago quarter
- Driven by continued strong double-digit growth in all channels of trade, as well as distribution expansion.
- International revenue decreased 15% to $8.4 million, down from $10.0 million in the year ago period
- Mainly due to a change in our China business model to a royalty and licensing framework effective January 1, 2019 which mitigates risk and reduces marketing investments, but correspondingly decreased revenue by $2.1 million
- Offset partly by an increase in Nordic distribution partner revenues by $531,000
- Gross profit of $21.2 million, up 36% from $15.6 million in the year ago period
- Net income to common shareholders of $11.1 million compared to a net loss to common shareholders of $(10.5) million in the year ago period
- Non-GAAP Adjusted EBITDA* was $3.4 million compared to $(2.1) million in the year ago period
- Domestic revenue increased 52% to $42.6 million, up from $28.0 million in the year ago quarter
Subsequent to Quarter-End:
- Completed the acquisition of Func Food Group Oyj (“Func Food”) for total consideration of $24.2 million including $14.8 million in cash and the assumption of $9.4 million of outstanding debt
- Strengthened its partnership with Kroger, the largest U.S. grocery store chain, to carry Celsius in over 1,100 locations nationwide
- Signed national authorization with Foodbuy LLC, the largest foodservice procurement and supply chain solutions organization in North America with over 85,000+ unique customer locations
- Launched its newest flavor, Grapefruit Melon Green Tea
“Our focus on driving higher volumes through deeper placements in existing accounts and new distribution expansion resulted in a solid, double-digit increase in revenue again in the third quarter,” said John Fieldly, President and Chief Executive Officer. “This, combined with the restructuring of our business model in China earlier this year and our emphasis on controlling costs, enabled us to deliver positive net income of $961,042 for the third quarter all while driving record revenues. Demand for the CELSIUS® portfolio of products remains robust, and we are seizing a number of opportunities to further increase distribution while continuing to introduce new flavors and strengthen existing relationships to capture additional market share and meet this increasing demand for our portfolio. We are on pace for a record 2019 with year-to-date revenue of $51.0 million, which compares to $52.6 million for the full year 2018. We are increasingly confident in our ability to capture a meaningful share of the consumer beverage market. Favorable market trends and strong consumer demand for healthy beverages combined with our ability to scale rapidly positions us for continued success. Our strategy of positioning Celsius as the global leader for health-minded consumers remains our top priority.”
Third Quarter Ended September 30, 2019 Compared to Third Quarter Ended September 30, 2018
Revenue
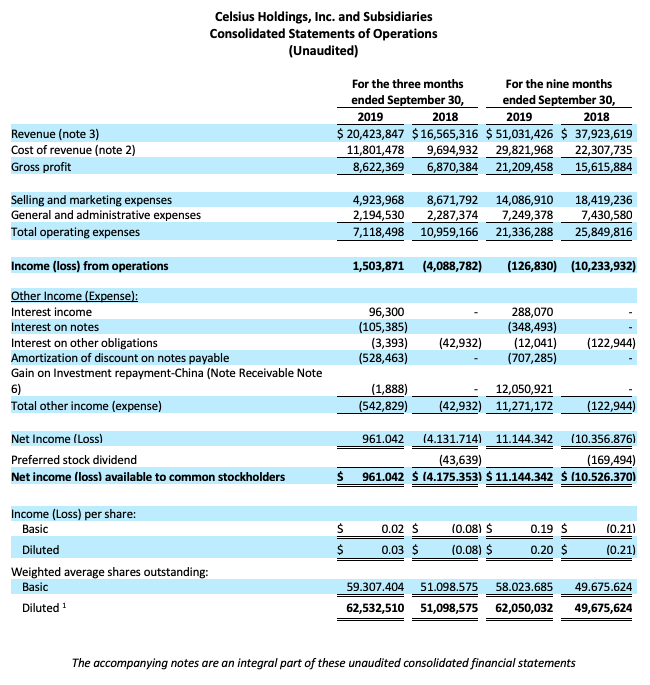
For the three months ended September 30, 2019, revenue was $20.4 million, an increase of $3.8 million or 23%, from $16.6 million for the 2018 quarter. The increase of 23% was driven by continued strong growth of 47% in North American revenue attributable to double-digit growth in both existing accounts and new distribution expansion. Revenue in Europe declined 11% mainly as a result of timing of orders and promotional programs. Revenue in Asia reflects the change in the company’s business model in China to a royalty and license fee arrangement. The total increase in revenue is primarily attributable to an increase in sales volume, as opposed to increases in product pricing.
The following table sets forth revenue by geography and changes therein for the three and nine month periods ended September 30, 2019 and 2018:
| Three months ended September 30, | Nine months ended September 30, | ||||||||||||||||||
| Revenue Source | 2019 | 2018 | % Change | 2019 | 2018 | % Change | |||||||||||||
| Total Revenue | $ | 20,423,848 | $ | 16,565,316 | 23% | $ | 51,031,426 | $ | 37,923,619 | 35% | |||||||||
| North America | $ | 16,765,598 | $ | 11,360,474 | 47% | $ | 42,607,434 | $ | 27,963,164 | 52% | |||||||||
| Europe | $ | 3,374,868 | $ | 3,809,645 | (11)% | $ | 7,635,845 | $ | 7,104,473 | 7% | |||||||||
| Asia | $ | 194,982 | $ | 1,351,215 | (86)% | $ | 629,028 | $ | 2,708,756 | (77)% | |||||||||
| Other | $ | 88,400 | $ | 43,982 | 101% | $ | 159,120 | $ | 147,226 | 8% | |||||||||
Gross profit
For the three months ended September 30, 2019, gross profit increased by $1.7 million, or 26%, to $8.6 million, from $6.9 million for the same quarter in 2018. Gross profit margin for the three months ended September 30, 2019 was 42.2%, which compares favorably to 41.5% for the 2018 quarter. The increase in gross profit dollars is mainly related to increases in sales volume, as opposed to increases in product pricing.
Sales and marketing expenses
Selling and marketing expenses for the three months ended September 30, 2019 were $4.9 million, a decrease of $3.8 million, or 43%, from $8.7 million in the same quarter in 2018. The decrease from the 2018 quarter to the 2019 quarter is primarily due to lower marketing expense of $5.1 million related to the change in the Company’s China business model to a royalty and licensing framework effective January 1, 2019, partially offset by increases in other marketing initiatives of $263,000 in expense related to distributor support and investments in trade activities of $698,000 and broker commissions, storage ,and distribution costs of $381,000 due to the increase of business volume from the 2018 quarter.
General and administrative expenses
General and administrative expenses for the three months ended September 30, 2019 were $2.2 million, a decrease of $93,000, or 4%, from $2.3 million for the three months ended September 30, 2018. The decrease was primarily due to lower stock option expense of $253,000 and a reduction in administrative expenses of $33,000, partially offset by increases in expenses related to the acquisition of Func Food of $145,000, as well as increases in other general and administrative expenses of $48,000 from the 2018 quarter.
Other income / (expense)
Total other expense increased to $542,829 for the three months ended September 30, 2019 from $43,000 for the three months ended September 30, 2018. The increase is primarily the result of interest expense of $109,000 and the amortization of discounts on notes payable of $528,000, which was partially offset by interest income related to a receivable from our China license of $96,300.
Net Income (Loss):
As a result of the above, for the three months ended September 30, 2019, net income to common shareholders was $961,042, or $0.02 per basic share based on a weighted average of 59,307,404 shares outstanding and after adding back interest expense on convertible notes of $105,385 and amortization of discounts on notes payable of $528,464, a dilutive net income available to common shareholders of $1.6 million or $0.03 per share, based on a weighted average of 62,532,510 shares outstanding which includes the dilutive impact of the stock options of 992,693 shares and the dilutive effect of the convertible notes of 2,232,412 shares. In comparison, for the three months ended September 30, 2018, the company reported a net loss of $4.2 million, inclusive of preferred stock dividends of $44,000, or a loss of $(0.08) per basic and diluted shares, based on a weighted average of 51,098,575 shares outstanding.
The year-over-year increase in share count was primarily the result of the conversion of preferred stock to common stock at the end of 2018 and shares issued in our September 2019 public offering.
Nine Months ended September 30, 2019 compared to Nine Months ended September 30, 2018
Revenue
For the nine months ended September 30, 2019, revenue was $51.0 million, an increase of $13.1 million, or 35%, from $37.9 million for the nine months ending September 30, 2018. The revenue increase of 35% was attributable in large part to strong growth of 52% in North American revenue driven by double-digit growth in existing accounts and new distribution expansion. In addition, European revenue increased 7% mainly as a result of the launch of new flavors. These increases were partially offset by a decline in Asian revenues as a result of the change in the Company’s China business model to a royalty and license fee arrangement effective January 1, 2019. The total increase in revenue was primarily due to an increase in sales volume, as opposed to increases in product pricing.
Gross profit
For the nine months ended September 30, 2019, gross profit increased by $5.6 million, or 35.8%, to $21.2 million, as compared to $15.6 million for the nine months ended September 30, 2018. Gross profit margin increased by 38 basis points to 41.6% for the nine months ended September 30, 2019, as compared to 41.2% for the nine months ended September 30, 2018. The increase in gross profit dollars is mainly related to an increase in sales volume, as opposed to increases in product pricing.
Sales and marketing expenses
Sales and marketing expenses for the nine months ended September 30, 2019 were $14.1 million, a decrease of $4.3 million, or 24%, from $18.4 million in the same period in 2018. The decrease from 2018 period to the 2019 period is due primarily to the change in our China business model to a royalty and licensing framework effective January 1, 2019, which does not require direct marketing investments by the Company. The reduction in sales and marketing expenses related to China was $8.1 million and was partially offset by increases in investment in other marketing initiatives of $506,000, support to distributors and investments in trade activities to support the Company’s expanded distribution network of $1.8 million, investments in sales personnel costs of $350,000 and related travel expenses, and higher broker commissions and storage and distribution costs of $1.1 million due to the increase in our business volume.
General and administrative expenses
General and administrative expenses for the nine months ended September 30, 2019 were $7.2 million, a decrease of $181,000, or 2.4%, down from $7.4 million for the nine months ended September 30, 2018. The decrease was primarily due to the inclusion of an accrual of $945,000 in the prior year period that pertained to the settlement of a territorial dispute with a former distributor. Excluding this impact, general and administrative expenses increased $764,000 from the 2018 period to the 2019 period primarily as a result of incremental stock option expense of $250,000, an increase of $145,000 related to the acquisition of Func Food and a $361,000 increase in employee costs and other professional and business costs to support the Company’s continued growth.
Other income / (expense)
Total other income increased by approximately $11.3 million for the nine months ended September 30, 2019 from ($123,000) in the comparable 2018 period primarily as a result of the recognition of a gain pertaining to the agreement executed with our China distributor to repay the investment the Company made in the China market during 2017 and 2018. This has been recorded as a corresponding note receivable from our China distributor on the Balance Sheet, which is payable over a five-year period, on an unsecured, interest-bearing basis.
Net income
As a result of the above, for the nine months ended September 30, 2019, net income to common shareholders was $11.1 million, or $0.19 per basic share based on a weighted average of 58,023,685 shares outstanding and after adding back interest expense on convertible notes of $348,493 and amortization of discount on notes payable of $707,286, a dilutive net income available to common shareholders of $12.2 million or $0.20 per share, based on a weighted average of 62,050,032 shares outstanding which includes the dilutive impact of the stock options of 1,223,700 shares and the dilutive effect of the convertible notes of 2,802,647 shares. In comparison, for the nine months ended September 30, 2018 we had net loss of approximately $10.4 million, and after giving effect to preferred stock dividends of approximately $169,494, a net loss available to common shareholders of $10.5 million or a loss of $0.21 per basic and diluted shares, based on a weighted average of 49,675,624 shares outstanding.
The year-over-year increase in share count was primarily the result of the conversion of preferred stock to common stock at the end of 2018 and shares issued in our September 2019 public offering.
Liquidity and Capital Resources
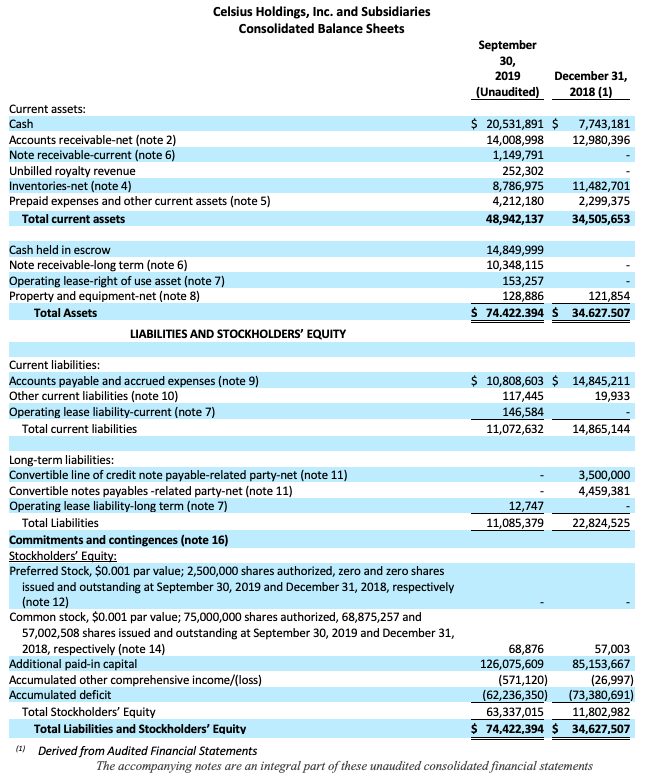
As of September 30, 2019, we had cash of $20.5 million compared to $7.7 million as of December 31, 2018. We had working capital of $37.9 million as of September 30, 2019 compared to $19.6 million as of December 31, 2018. Cash used in operations during the nine months ended September 30, 2019 and September 30, 2018, totaled approximately $16.0 million and $9.0 million, respectively, mainly related to the investment in the acquisition of our Nordics distributor, increases in accounts receivable related to increase in sales, which were partially offset by reduction in inventories.
Conference Call
Management will host a conference call today, Thursday, November 7, 2019 at 10 a.m. ET to discuss the results with the investment community.
To participate in the conference call, please call one of the following telephone numbers at least 10 minutes before the start of the call:
US: 877-709-8150
International: 201-689-8354
An audio replay of the call will be available on the Company’s website at https://www.celsiusholdingsinc.com/press-releases/
Disclosures can be found on the Company’s online disclosure portal at: https://www.celsiusholdingsinc.com/sec-filings/.
About Celsius Holdings, Inc.
Celsius Holdings, Inc. (Nasdaq: CELH), founded in April 2004, is a global company with a proprietary, clinically proven formula for its brand CELSIUS®. Celsius Holdings, Inc. has a corporate mission to become the global leader of a branded portfolio consisting of proprietary, clinically proven innovations which offer significant health benefits. CELSIUS®’ Original Line comes in nine delicious sparkling and non-carbonated flavors in sleek 12oz cans and is also available in single-serve powdered packets. CELSIUS®’ Stevia Sweetened Line is available in four refreshing flavors and the line is naturally caffeinated and naturally sweetened.
New to the portfolio, trainer-grade CELSIUS HEAT™ offers an additional 100mg of caffeine over CELSIUS®, to total 300mg per can, and also contains 2,000mg of L-citrulline, a vasodilator. CELSIUS HEAT™ is sold in 16oz cans and is available in five carbonated flavors. CELSIUS HEAT™ is a thermogenic pre-workout drink and targets professional trainers, competitive athletes, the military and first responders. CELSIUS HEAT™ was developed for those seeking a trainer-grade version of CELSIUS® versus the Original Line, which is sold in a smaller can package and appeals to the masses as an active lifestyle brand.
CELSIUS® has zero sugar, no aspartame, no high fructose corn syrup, and is non-GMO, with no artificial flavors or colors. The CELSIUS® line of products is Certified Kosher and Vegan. CELSIUS® is also soy and gluten free and contains very little sodium. CELSIUS® is sold nationally at fitness clubs, 7-Eleven, Sprouts, The Fresh Market and key regional retailers such as HEB, Publix, Winn-Dixie, Harris Teeter, Shaw’s, Food Lion, CVS and many others.
CELSIUS®’ functional claims are backed by nine published university studies. The first study was conducted in 2005 and additional studies from the University of Oklahoma were conducted over the next five years. The studies were published in peer-reviewed journals and validate the unique benefits that CELSIUS® provides. For more information, please visit https://www.celsiusholdingsinc.com
Forward-Looking Statements
This press release may contain statements that are not historical facts and are considered forward-looking within the meaning of the Private Securities Litigation Reform Act of 1995. These forward-looking statements contain projections of Celsius Holdings’ future results of operations and/or financial position, or state other forward-looking information. In some cases, you can identify these statements by forward-looking words such as “anticipate,” “believe,” “could,” “estimate,” “expect,” “intend,” “may,” “should,” “will,” “would,” or similar words. You should not rely on forward-looking statements since Celsius Holdings’ actual results may differ materially from those indicated by forward-looking statements as a result of a number of important factors. These factors include, but are not limited to: general economic and business conditions; our business strategy for expanding our presence in our industry; anticipated trends in our financial condition and results of operation; the impact of competition and technology change; existing and future regulations affecting our business; and other risks and uncertainties discussed in the reports Celsius Holdings has filed previously with the Securities and Exchange Commission. Celsius Holdings does not intend to and undertakes no duty to update the information contained in this press release.
— Tables Follow —

*The Company reports financial results in accordance with accounting principles generally accepted in the United States (“GAAP”), but believe that disclosure of adjusted EBITDA, a non-GAAP financial measure, may provide users with additional insights into operating performance.
Investor Relations:
Cameron Donahue
(651) 653-1854
cameron@haydenir.com
